Place on the Path to Community Employment

Employment First is a policy to ensure every person with a developmental disability of working age has an opportunity to seek community employment. Community employment brings many benefits including the opportunity to build self-esteem, make friends, and improve quality of life.
A person-centered planning process supports each person accessing services to identify their desired employment goal and their Place on the Path to Community Employment (PPCE). This person-centered planning process will help the person receiving services to choose a job goal and the services to support this goal.
To identify where a person may be on their journey to community employment, four places on the path have been identified. Identifying the place a person occupies on the path to community employment offers ideas of what type of supports a person might need to move towards their desired employment goals.
Place on the Path to Community Employment include:
Place 1 – I have a job but would like a better one or to move up.
Place 2 – I want a job! I need help to find one.
Place 3 – I’m not sure about work. I need help to learn more.
Place 4 – I don’t think I want to work, but I may not know enough about it.
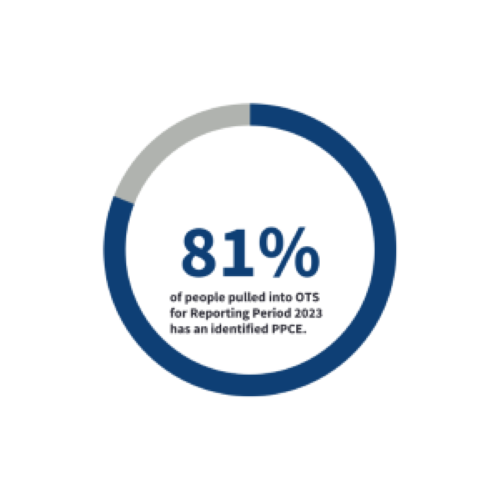
In Reporting Period 2023, we had a 27% increase in the number of people with an identified PPCE, with 31,688 people! DODD recognizes and appreciates your hard work! Thank you!

The map below shows you the breakdown of those 31,688 people per county that have an identified PPCE.
If you hover over a specific county, you will see where people are on their Path to Community Employment.
If a county is blank/missing on the below map, that means that specific county did not have any entries for the PPCE for this Reporting Period.
Place on the Path to Community Employment Map
The vizzes below break down the Places on the Path to Community Employment further.
The viz on the left shows you the statewide breakdown of the Places on the Path to Community Employment over time.
In Reporting Period 2023, most people (12,572) are on Place 4 - I don't think I want to work, but I may not know enough about it (40%), which indicates that they don’t think they want to work but may not know enough about it. This is a 28% increase from Reporting Period 2022.
26% of people (8,237) are on Place 3 - I'm not sure about work. I need help to learn more, where the person may not be sure if they want to work. This is a 4% increase from Reporting Period 2022.
10% of people (3,109) are on Place 2 - I want a job! I need help to find one. These people would like to have a community job and need assistance in obtaining one. This is less than a half percent decrease from Reporting Period 2022.
25% of people (7,770) are on Place 1 - I have a job but would like a better one or to move up. These people are employed in a community job and may like to find a better job or would like to be promoted within their current job. This is a 12% increase from Reporting Period 2020.
The viz on the right shows the number of people over time that do not have a Place on the Path identified. This number continues to decrease year-after-year, and decreased by 45% from Reporting Period 2022 to 2023.
PPCE Over Time
The pie chart on the left shows the breakdown of the Places on the Path for the respective Reporting Period that you choose.
The column chart on the right shows if the County Board or an Intermediate Care Facility (ICF) entered the Place on the Path.
For Reporting Period 2023, 88% of the entries entered for the Place on the Path to Community Employment was entered by County Boards of Developmental Disabilities (CBs), and 12% of PPCEs were entered by Intermediate Care Facilities (ICFs). The percentage did not change for either the CBs or ICFs from Reporting Period 2022 to 2023.
PPCE Percentages and Who Entered the PPCE
The majority of people with an identified PPCE in Reporting Period 2023 resided with their family or relative (49%).
16% lived alone;
19% lived in a congregate setting;
12% lived in an Intermediate Care Facility (ICF) or Developmental Center;
3% lived in foster care or a shared living setting; and
2% of those with an identified PPCE did not have a known living arrangement noted in our systems or they lived in an "other" living arrangement category.
The "other" category includes residential facilities, nursing home, criminal justice facility, and temporary living arrangements.
Living Arrangement for Those with an Identified PPCE
The stacked column chart below shows you the breakdown of the Places on the Path to Community Employment by Living Arrangement for Reporting Period 2023.
Within each living arrangement category, the majority of people are on Place 4 - I don't think I want to work, but I may not know enough about it.
Living Arrangement by PPCE
Amongst the 31,688 people that had an identified PPCE for Reporting Period 2023, the majority of people were White/Caucasian (72%) and were Non-Hispanic or Latino (90%).
The below visualizations show you the breakdown of race in the left viz, and the breakdown of ethnicity in the middle viz.
Demographics for Those with an Identified PPCE
The viz below shows you the breakdown of both Race and Ethnicity for Reporting Period 2023.
The majority of people are White/Caucasian and Non-Hispanic or Latino (76%).
Race by Ethnicity
The majority of people that had an identified PPCE for Reporting Period 2023 were male (60%).
Most people were in the 30-39 years old (27%) and 22-29 years old (22%) age ranges.
The average age of those with an identified PPCE is 42 years of age.
The visualization below shows you the gender break down in the left viz and the age groupings in the right viz.
